Skip to content

Blog

Which Platform Is The Easiest for Growing Followers in 2025

TikTok emerges as the clear frontrunner for ease of follower growth in 2025, with its algorithm design and engagement metrics significantly outpacing competitors. While each platform offers unique advantages for different types of content creators, the data strongly indicates that new accounts can gain traction fastest on TikTok, followed by Instagram, with other platforms presenting greater challenges for organic growth.

TikTok continues to dominate as the platform where gaining followers is most accessible, particularly for new accounts with no established audience. This advantage stems from several key factors that make the platform uniquely positioned for rapid growth:

TikTok’s algorithm stands apart from other platforms by focusing primarily on content quality rather than account size. Unlike platforms that prioritize existing popularity, TikTok’s For You Page can propel unknown creators to viral status overnight. The platform is explicitly designed to “promote content based on engagement rather than follower count, making it possible for anyone to go viral”.

This algorithmic approach means that a compelling video from a brand-new account has nearly the same chance of being seen as content from established creators. As one analysis directly states, “It’s easier to grow and go viral on TikTok because its algorithm favors content that engages users regardless of the creator’s follower count”.

The numbers strongly support TikTok’s position as the growth leader. In 2025, TikTok maintains an organic engagement rate of 2.50%, dramatically outperforming Instagram (0.50%) and Facebook/X (both at 0.15%). This engagement advantage translates directly to faster follower acquisition.

Additionally, TikTok posts generate substantially more interaction, averaging “66 comments each, representing a 73% increase year-over-year,” compared to Instagram’s 24 comments per post. This higher engagement rate creates a virtuous cycle for follower growth.

TikTok’s short-form video format is particularly conducive to viral sharing. The platform offers multiple creative tools that make producing engaging content accessible even to beginners:

“TikTok’s meteoric rise in popularity has made it a prime platform for those looking to gain followers quickly… Even new accounts can achieve viral status with the right content… [with] short-form videos that appeal to short attention spans [and] built-in editing features”.

While not as rapid for growth as TikTok, Instagram remains a strong platform for follower acquisition, though with different dynamics:

Instagram’s introduction of Reels was a direct response to TikTok’s success, and this feature has become the platform’s most powerful growth driver. However, Instagram’s algorithm tends to “lean towards showing content from accounts that users already follow”, creating a higher initial barrier for new accounts.

Despite the higher barrier to entry, Instagram offers sophisticated tools for targeted growth. The platform’s hashtag system, when properly utilized, can help content reach specific audiences interested in particular topics. Additionally, Instagram’s integration with Facebook’s advertising infrastructure provides powerful paid growth options.

Some accounts, particularly those with fewer than 10,000 followers, have seen significant growth through strategic use of Stories, with “a 35% increase in Story reach rate” noted in recent studies.

For creators and brands with strong visual content, Instagram’s image-centric format can be advantageous. The platform remains a “visual powerhouse” where “high engagement” and “effective use of hashtags can significantly increase visibility and attract new followers”.

Twitter (now X) presents a more difficult landscape for follower growth in 2025, though certain strategies can yield results:

Despite various tactics for “boosting Twitter followers in 30 days or less”, the platform’s low organic engagement rate of just 0.15% makes it challenging to gain traction without an established presence or network.

When deciding which platform to prioritize for follower growth, consider:

  1. Starting position: If you’re building from zero, TikTok offers the most level playing field.
  2. Content format strengths: Visual brands may perform better on Instagram, while those who excel at quick, entertaining videos will find TikTok more advantageous.
  3. Target demographic: Though TikTok skews younger, it has broadened its demographic reach in recent years.

The evidence overwhelmingly suggests that TikTok provides the easiest path to follower growth in 2025, particularly for new accounts. Its unique algorithm that prioritizes content quality over creator popularity, combined with the highest engagement rates across major platforms, creates an environment where rapid growth is not just possible but common.

Instagram maintains its position as a strong secondary option, especially for visually-oriented creators who can leverage its multiple content formats. However, Twitter and Facebook present significantly higher challenges for organic follower acquisition due to their mature ecosystems and lower engagement rates.

For most creators and brands starting fresh, focusing initial growth efforts on TikTok will likely yield the fastest follower gains, with Instagram serving as a valuable complementary platform as the audience expands.

How AI Tracks Social Media Content for Print-on-Demand

AI tools like Print2Social make managing social media for print-on-demand businesses easier by automating content creation, scheduling, and performance tracking. Here’s how it works:

  • Content Creation: For each product, AI generates 12 images (e.g., mockups) and 8 videos, ready for social media.
  • Scheduling: Posts are automatically scheduled for peak engagement times, saving you time.
  • Performance Tracking: Tracks key metrics like engagement rate, reach, impressions, click-through rate, and conversions in real time.
  • Insights: Provides actionable data to refine your strategy and improve results.

Metricool

AI tools like Print2Social streamline social media marketing for print-on-demand businesses by handling tasks like content creation, scheduling, and distribution automatically. Once you link your store and social accounts, Print2Social generates and schedules posts for you. It also tracks performance metrics - such as likes, comments, shares, reach, and engagement rate - in real time. This setup allows you to focus on strategy while machine learning works to refine your social media efforts continuously.

Let’s take a closer look at the specific metrics AI tracks to gauge social media performance.

Print2Social

Set up Print2Social in just three steps to streamline your content creation and scheduling process.

  • Connect your print-on-demand provider account to sync your product catalog.
  • Link your social media accounts.
  • Choose specific products or categories you want to promote.

Print2Social creates 12 images (including lifestyle photos and detailed mockups) and 8 short videos for each product. These are then combined into ready-to-review social media posts.

  • Use the content calendar to preview and edit posts.
  • Customize posting times and frequency to match your strategy.
  • Compare different content options and pick the best versions.

Once your posts are scheduled, it’s time to monitor key performance indicators (KPIs) to fine-tune your strategy and boost results.

Keep an eye on these essential metrics to understand how your content is performing:

  • Engagement rate: The ratio of interactions (likes, comments, shares) to impressions.
  • Reach: The number of unique users who viewed your post.
  • Impressions: The total number of times your post was viewed.
  • Click-through rate (CTR): The percentage of clicks compared to impressions.
  • Conversion rate: The percentage of users who completed a desired action (like making a purchase or signing up) after clicking.
  • Follower growth: The net increase in followers over a specific period.

Your dashboard is a powerful tool for tracking and analyzing performance. Here’s how to make the most of it:

  • Monitor scheduled posts alongside live metrics to see how your content is performing in real time.
  • Filter results by platform, date range, or post type to focus on specific campaigns or timeframes.
  • Compare campaign outcomes to identify trends and determine what works best.
  • Export reports for deeper analysis and to share insights with your team.

Use performance metrics and AI insights to fine-tune your content and streamline scheduling processes.

Evaluate visuals, posting times, and content formats to identify what resonates most with your audience. This helps you focus on the formats and themes that deliver the best results.

Print2Social takes care of scheduling posts during high-engagement periods, ensuring consistent output. You can review AI-generated post variations, sync your calendar with optimal engagement windows, and track performance in real time.

AI-powered social media tracking has transformed how print-on-demand businesses handle their online presence and marketing strategies.

By linking your print-on-demand store with your social media accounts, you can automate tasks like content creation, scheduling, and maintaining a consistent feed. This gives you more time to focus on strategic growth.

Use AI tools to gain real-time insights into engagement, reach, and conversions. These insights help fine-tune your posting schedule, improve your content, and scale your print-on-demand business effectively.

How To Analyze Competitor Social Media Tactics

Here’s how competitor analysis can help:

  • Identify posting patterns: Learn the best times and frequency for posting.
  • Understand engagement trends: Track likes, comments, shares, and audience activity.
  • Spot opportunities: Find market gaps and avoid common mistakes.
  • Refine your content: Discover what works and apply it to your strategy.

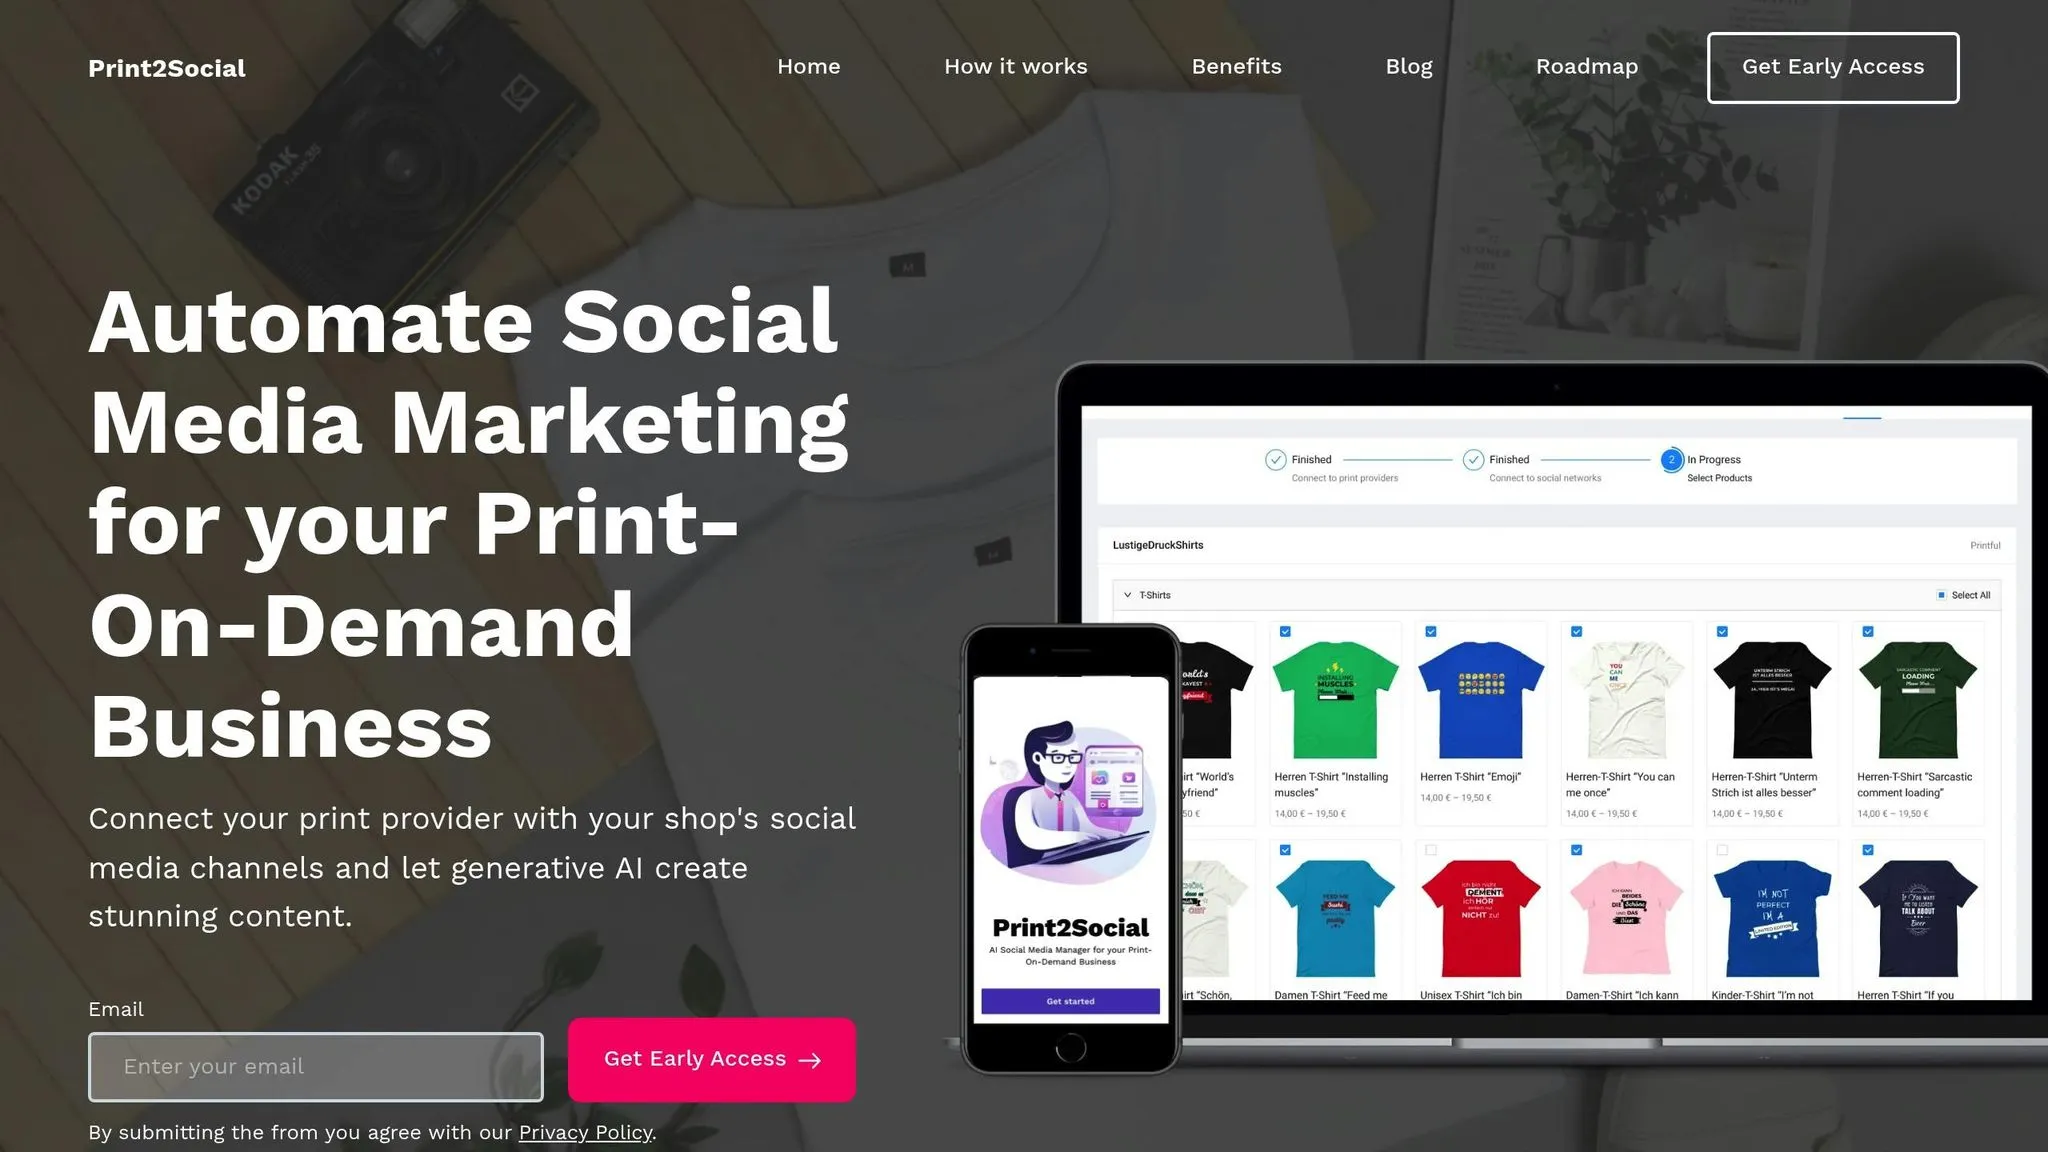
Use tools like Print2Social to automate data collection and content creation, saving time while improving efficiency.

  1. Find competitors using hashtags like #PODmerch or #customapparel.
  2. Track metrics like engagement, growth, and content performance.
  3. Analyze content types, visuals, and audience interaction patterns.
  4. Leverage automation to streamline tracking and content creation.

Quick Tip: Regularly review data to stay updated on trends and adjust your strategy for better results.

How to Do a Competitor Analysis on Social Media

Section titled “How to Do a Competitor Analysis on Social Media”

Understanding your competitors is key to refining your social media strategy. Here’s how you can identify and monitor your rivals effectively.

Competitors generally fall into two categories:

  • Direct competitors: Businesses offering similar print-on-demand (POD) products to the same audience.
  • Indirect competitors: Companies selling different products but vying for the attention of your target customers.

To create a competitor list:

  • Search for industry-specific hashtags like #PODmerch, #customapparel, and #printondemand to discover sellers.
  • Keep an eye on trending designs and popular product categories in your niche.
  • Identify businesses that cater to the same audience as you.
  • Observe engagement on competitor product posts to gauge their reach.

Focus on competitors that align with your business size and target audience. For instance, a small custom t-shirt shop doesn’t need to compare itself to large retail chains.

Once you’ve identified your competitors, the next step is analyzing their social media activity.

Take a closer look at your competitors’ social media activity, especially on platforms that resonate with your audience. Tools like Print2Social can simplify tracking their posting habits and engagement metrics.

Here’s how to map their presence effectively:

  • Document platform activity: Note which platforms they use most frequently.
  • Track posting frequency: Monitor how often they post on each platform.
  • Analyze content mix: Look at the balance between promotional posts, educational content, and audience engagement.
  • Record engagement patterns: Identify when their audience is most active and responsive.

Platform Activity Tracking

What to Monitor

Post Frequency

Number of posts daily or weekly

Content Types

Product showcases, behind-the-scenes, customer highlights

Peak Engagement Times

Days and times with the highest engagement

Response Rate

How quickly they respond to comments and messages

To analyze competitors effectively, focus on specific metrics that reveal their social media performance. Here are the key areas to monitor:

Metric Category

Key Indicators to Track

Engagement

Likes, comments, shares, saves

Growth

Weekly/monthly follower increases

Content Performance

Post reach, click-through rates

Audience Response

Comment sentiment, response times

Posting Patterns

Frequency, timing, platform usage

Monitor these metrics consistently over 30–90 days. This timeframe helps you identify patterns and trends that can lead to actionable insights.

Organize your data efficiently with the right tools and processes.

Tracking Competitor Data

  • Create a dedicated spreadsheet for each competitor.
  • Record daily metrics, campaign activities, and content themes.

For a more automated approach, consider using AI-powered tools like Print2Social. These tools can help you track content performance and identify trends while you focus on managing your social media efforts.

Once you’ve gathered structured data, dig deeper into your competitor’s content strategies by examining the following:

Content Types

  • Product highlights
  • Educational posts
  • Behind-the-scenes content
  • Customer reviews or testimonials
  • Promotions and special offers

Visual Elements
Evaluate how competitors use visuals like photos, videos, graphics, and consistent branding to enhance their posts.

Engagement Trends
Pay attention to how different content performs:

  • Posts that get the most saves
  • Content driving the highest number of comments
  • Shares generated by specific posts
  • How timing affects engagement levels

For print-on-demand businesses, tools like Print2Social can simplify this process by generating multiple content variations. This allows you to test strategies inspired by competitor insights and refine your approach.

Looking at how your competitors operate can help you refine your approach by highlighting what works and where there’s room for improvement.

Dive into how competitors interact with their audience to pick up effective social media tactics. Pay attention to these key areas:

Response Time and Quality
Monitor how quickly and effectively competitors reply to comments and messages. Take note of whether they:

  • Address customers personally (using their names)
  • Provide clear and helpful solutions
  • Maintain a consistent tone and style
  • Follow up on unresolved issues

Community Building Activities
Check out how competitors build and engage their communities. Here are some common approaches:

Activity Type

Purpose

Common Formats

User-Generated Content

Build trust through real input

Customer photos, reviews, testimonials

Live Sessions

Foster real-time interaction

Q&As, product demos, behind-the-scenes

Interactive Posts

Encourage audience participation

Polls, quizzes, discussion prompts

Community Challenges

Create shared experiences

Hashtag campaigns, themed contests

Next, evaluate the types of content that generate the most engagement.

To keep up with trends, focus on creating varied and engaging content. Tools like Print2Social, which can produce 12 images and 8 short videos per product, show how AI can streamline content creation.

Content Categories That Drive Engagement

  • Educational Content
    Share posts that solve problems or provide valuable information to build credibility.
  • Product Showcases
    Highlight your products through:
    • Lifestyle photos
    • Tutorial videos
    • Customer success stories
    • Feature highlights
  • Engagement-Focused Posts
    Use content designed to spark interaction, such as polls, questions, or games.

Once you’ve identified high-performing content, take a deeper look at each competitor’s overall strategy to spot their strengths and weaknesses.

Platform Effectiveness
Analyze how well competitors perform on different platforms by reviewing:

  • Engagement rates
  • Growth in followers
  • Performance of their content
  • Audience demographics

Content Strategy Assessment

Area

What to Analyze

Why It Matters

Content Quality

Visual appeal, clear messaging

Shapes audience’s first impressions

Posting Consistency

Frequency, timing patterns

Impacts visibility and algorithm success

Campaign Success

Effectiveness of promotions

Highlights what resonates with the audience

Brand Voice

Style and tone of communication

Shows how they position themselves

Use the insights from your competitor analysis to pinpoint areas where your business can stand out and perform better.

Look for areas where your print-on-demand business can make a mark. Some opportunities to consider:

  • Product Lifestyle Content
    Show your products in everyday settings. Use tools like Print2Social’s AI image generator to create diverse and engaging lifestyle images.
  • Video Demonstrations
    Highlight product features and quality through automated video demos. These can help customers better understand your offerings.
  • Behind-the-Scenes Content
    Build trust by sharing how your designs are created or how your production process works.
  • Educational Material
    Solve customer challenges with practical guides and usage tips. This type of content can position your brand as helpful and knowledgeable.

Engagement Opportunities
Pay attention to times when competitors see lower engagement, such as early mornings, late nights, weekends, or certain holidays. Use this data to schedule your posts strategically and stand out during those quieter periods.

Underserved Audience Segments
Look for customer groups your competitors might be ignoring. For instance, if they focus on younger audiences, consider crafting content that resonates with older demographics.

Once you’ve identified these gaps, set clear, measurable goals to make the most of these opportunities.

Create achievable goals by comparing your metrics to competitor benchmarks. Focus on gradually improving engagement metrics like post interactions, story views, video watch time, and responsiveness. Here’s how you can approach it:

  1. Post Frequency
    Study how often competitors post and find a rhythm that works for your audience. Use Print2Social’s automation tools to maintain consistency.
  2. Content Mix
    Balance your strategy by incorporating a variety of content types. Include product showcases, educational posts, engagement-driven content, and behind-the-scenes glimpses to cover all bases.
  3. Growth Metrics
    Track key indicators like follower growth, reach, impressions, click-through rates, and conversions from social traffic. These metrics will help you measure progress and refine your approach.

Monitoring and Adjustment
Keep a close eye on your performance data and tweak your strategy as needed. If something isn’t working, take advantage of Print2Social’s content generation tools to test new ideas quickly and efficiently.

Automation tools can simplify your workflow by helping you monitor competitors and execute content strategies more efficiently. Print2Social offers AI-powered features to make this process easier:

Content Creation and Analysis

  • Generate lifestyle images and video demos automatically.
  • Test strategies with different types of content.
  • Balance your posts between promotional, educational, and engaging material.

Scheduling Made Easier

  • Post at optimal times based on platform guidelines.
  • Keep a consistent posting schedule.
  • Automate content distribution across multiple channels.

These tools not only save time but also help you stay competitive. The next step is ensuring your strategy stays up-to-date with current trends.

Automation tools don’t just save time - they also make it easier to adjust your strategy as needed. Staying on top of trends and competitor activity requires regular updates. Here’s how you can set up an effective routine:

Monitoring Schedule
Establish a schedule to track competitor activity consistently:

  • Daily: Check for new posts and engagement stats.
  • Weekly: Review content themes and performance trends.
  • Monthly: Evaluate your overall strategy and tweak automation settings.

Adjusting Your Strategy
Leverage automation tools to fine-tune your strategy based on competitor insights:

  • Content Tweaks: Identify which types of content perform best and adjust your automated content creation to reflect these trends. Keep your brand voice consistent while experimenting with variations.
  • Better Timing: Use engagement and audience activity data to post at the best times.
  • Measure Success: Compare your automated content’s performance to competitor benchmarks. Use this data to refine your AI settings and posting strategies.

Staying Adaptable
While automation simplifies many tasks, it’s essential to remain flexible. Keep an eye on market shifts and trends, and regularly review your automated systems to ensure they align with your goals. This balance between automation and adaptability will help you stay ahead.

Analyzing competitors’ social media performance is a key driver of success in the print-on-demand market. By tracking metrics and studying their content, businesses can uncover opportunities and set clear growth targets.

To make this process effective, regular monitoring and actionable takeaways are essential. A consistent approach ensures that automation tools can be used to their full potential.

Automation simplifies this effort. Tools like Print2Social use AI to help businesses by:

  • Generating a variety of visual content automatically
  • Creating balanced content suited for different platforms
  • Scheduling posts effortlessly
  • Fine-tuning brand messaging for better engagement

Leading print-on-demand companies combine competitor analysis with automation to stay ahead. As discussed earlier, Print2Social takes care of content creation and scheduling, freeing up businesses to focus on scaling and innovation.

Competitor analysis is an ongoing effort. Use the insights you gather to adjust and improve your strategy. With the right tools and a structured approach, you can turn competitor data into actionable steps that deliver real results.

Top Engagement Metrics for POD Stores

Want to grow your POD store? Start by tracking the right engagement metrics. These metrics reveal what your customers like, how they interact with your content, and what drives sales. Here’s a quick overview:

  • Social Media Likes: Identify popular designs and improve your content strategy.
  • Customer Comments: Understand feedback, address concerns, and boost engagement.
  • Content Sharing: Expand your reach when customers share your posts.
  • Click Rates (CTR): Measure how well your content drives traffic to your store.
  • Sales Conversion: Track how many visitors turn into buyers.
  • Total Engagement Score (TES): Combine all metrics for an overall performance view.

Tools like Print2Social automate content creation, scheduling, and tracking, saving you time while improving results. Focus on these metrics to refine your strategy and grow your store effectively.

Etsy Stats Explained & How to Get More Sales Using Data

Section titled “Etsy Stats Explained & How to Get More Sales Using Data”

Social media likes offer quick insights into customer interest in your POD store. They show which designs and products resonate with your audience.

Tracking likes can help you pinpoint:

  • Which product categories catch attention
  • Design styles that spark engagement
  • Presentation approaches that get the best response

This information can guide your approach to boost interaction with your audience.

Based on these insights, aim to diversify your content. Combine promotional posts with engaging visuals, such as:

  • Lifestyle Photos: Show your products in everyday settings.
  • Design Spotlights: Highlight your artwork with clear, detailed images.
  • Short Videos: Include clips of product demos or design creation.

AI tools can make your content strategy more effective. By creating multiple versions of product presentations, you can test what works best. Tools like Print2Social simplify this process by automating content variations and tracking likes.

Automated tools can monitor likes across your posts, helping you spot trends and adjust your strategy. Focus on engagement rates rather than raw numbers - a post with 100 likes from 1,000 followers is performing better than one with 200 likes from 10,000 followers. This data-driven approach ensures you’re prioritizing content that truly connects.

Customer comments provide more than just surface-level feedback - they offer detailed insights into customer opinions, concerns, and suggestions. These insights can guide your strategy and help improve your approach.

Pay attention to both the number and quality of comments. Look for:

  • Specific Product Feedback: Comments that mention particular design details or features.
  • Customer Service Issues: Questions or complaints about shipping, sizing, or material quality.
  • Suggestions for Improvement: Ideas for new products or variations.
  • Customer Conversations: Discussions between customers about your products.

Effective comment management is crucial. Follow these best practices:

  1. Reply within 2–4 hours during business hours.
  2. Personalize your responses by using the customer’s name and addressing specific points they’ve raised.
  3. Offer clear, actionable solutions to address their concerns.
  4. Follow up to ensure the issue has been resolved.

Print2Social’s analytics can help you track trends in customer sentiment and feedback. Use this data to make informed decisions about:

  • Improving products based on recurring feedback.
  • Exploring new design ideas that resonate with customers.
  • Adjusting your content strategy to increase engagement.
  • Enhancing customer service based on common issues.

Set up alerts for keywords that highlight service issues, praise, product inquiries, or design suggestions. Focus on:

  • Keywords signaling problems with service or delivery.
  • Positive feedback that can be reshared to boost brand credibility.
  • Questions about products or shipping.
  • Suggestions for new designs or improvements.

Customer comments can also reveal purchase intent and highlight barriers to buying. Pay attention to:

  • Products that generate questions before purchase.
  • Common concerns that may deter customers.
  • Features that spark interest or excitement.
  • Design elements that encourage conversation.

These insights go beyond traditional engagement metrics, giving you a direct view into what customers want and how to adjust your strategy to meet their needs.

Content sharing takes your POD store’s visibility to the next level by leveraging your customers’ networks. When followers share your posts, they essentially become advocates for your brand, helping you reach a broader audience.

Print2Social uses AI to produce a steady stream of visually appealing posts designed to be shared. This approach ensures your content stays fresh and engaging across all platforms.

To encourage sharing, vary the types of posts you create. Include a mix of:

  • Product highlights and special offers
  • Helpful tips on design and product care
  • Interactive content that invites engagement

This combination keeps your audience interested and more likely to share your posts.

Pay attention to what works. Tracking which posts get shared the most helps you fine-tune your strategy and grow your reach organically.

Print2Social simplifies the process by customizing posts for each platform and monitoring their performance. Focus on creating visually striking content that encourages sharing, such as:

  • Lifestyle photos showcasing products in real-life settings
  • Short videos that highlight product features
  • Formats designed specifically for each platform to maximize shares

Click-through rate (CTR) tells you how effective your content is at turning views into clicks.

For instance, if 1,000 people see your content and 50 of them click, your CTR is 5%. This metric helps you understand how well your content connects with your audience and where you can make improvements.

To increase clicks, focus on using eye-catching lifestyle images, short and engaging videos, and visuals designed for specific platforms. Tools like Print2Social’s AI can create different product presentation styles to see what works best.

Tracking tools can also pinpoint the times when your audience is most active. Use this data to schedule posts when engagement is highest and adjust your content based on click trends.

Finally, strong calls-to-action (CTAs) are key. Phrases like “Shop Now” or “Get Yours Today” encourage immediate action. Make sure your content matches the style and tone of each platform to keep CTRs high. Print2Social can help tailor your visuals and messages for maximum impact.

Sales conversion tells you what percentage of your visitors end up making a purchase. It’s a key indicator of how well your store is performing.

Here’s how to calculate it:
Conversion Rate = (Number of Sales ÷ Total Store Visitors) × 100

If you want to improve your store’s conversion rates, focus on these areas:

  • Use clear, high-quality images to showcase your products.
  • Add detailed size charts and specifications to reduce uncertainty.
  • Write short, precise descriptions that highlight key features.
  • Include reviews from real customers to build trust.

Your website’s functionality plays a big role in conversions. Make sure your site:

  • Loads quickly
  • Is easy to navigate
  • Offers a smooth and simple checkout process

Using tools like Print2Social can take this further. Their AI-powered content creation generates platform-specific product visuals and presentations. These are designed to connect with your audience and turn social media traffic into sales.

Don’t just stop at your overall conversion rate. Keep an eye on related metrics like:

  • Add-to-cart rate: How many visitors add items to their cart.
  • Cart abandonment rate: How often people leave before completing a purchase.
  • Checkout completion rate: The percentage of users who finish the checkout process.
  • Average order value: How much customers typically spend per order.

Finally, track conversion rates by traffic source. This helps you identify which channels bring the most value and where to focus your efforts.

The Total Engagement Score (TES) brings together multiple metrics to give you a clear picture of how your store is performing across different platforms.

TES combines key factors such as direct sales, social interactions, click-through rates, and time spent on your site. Each of these is weighted to create a single, comprehensive score. This approach makes it easier to track and compare your performance over time.

Tools like Print2Social can simplify tracking your engagement. You can create customized promotional content, schedule posts for the best times, and monitor how your efforts perform across various platforms - all in one place.

Use these strategies to improve your score:

  • Diversify Your Content: Include a mix of promotional, educational, and interactive posts.
  • Focus on Quality Visuals: Share sharp, appealing images and lifestyle shots that resonate with your audience.
  • Stay Consistent: Post regularly to keep your audience engaged.
  • Respond Quickly: Engage with comments and messages promptly to show your audience you’re active and attentive.

Use a real-time dashboard to dig deeper into your TES. Identify which content performs best, when your audience is most active, and which promotional tactics are driving results. This data can help you fine-tune your strategy for better outcomes.

Print2Social

Track engagement more effectively using Print2Social’s tools, which combine automation, scheduling, and performance analysis to simplify social media management for POD stores.

Print2Social offers an all-in-one solution for managing engagement and content creation. Its analytics suite monitors key metrics while automating the creation of social media posts.

Print2Social’s AI engine creates multiple content options for each product, including:

  • 12 product images featuring lifestyle shots
  • 8 short videos showcasing your designs
  • A mix of promotional and informational posts

This automation not only saves time but also ensures consistent engagement. Once the content is ready, the next step is scheduling it for maximum impact.

The platform uses an algorithm to identify the best times to post and automatically shares your content across your social media channels.

Keep track of your engagement metrics with a centralized dashboard that provides insights like:

Metric Type

Measures

Value

Visual Content

Image and video performance

Identifies which product visuals generate the most engagement

Post Balance

Content type distribution

Ensures a balanced mix of promotional and informational posts

Scheduling

Timing effectiveness

Highlights the best posting times for higher engagement

Campaign Results

Overall engagement rates

Offers a clear view of your campaign’s success

These insights allow you to fine-tune your marketing strategy for better results.

Print2Social integrates with major POD platforms and social media networks. It can import product catalogs, generate content, schedule posts, and track engagement seamlessly.

While the system handles much of the content creation, you retain full control over your marketing efforts. Before publishing, you can:

  • Edit generated posts
  • Adjust posting schedules
  • Choose specific products or categories to promote
  • Refine the balance of content types

This flexibility ensures your brand’s voice and style remain consistent while benefiting from automation. By making data-driven adjustments, you can align your strategy with your engagement objectives.

Engagement metrics provide valuable insights that can directly influence the success of your POD store. The data highlights how meaningful social media interactions can boost sales conversions and fuel brand growth.

Here’s a quick breakdown of key metrics and their business impact:

Metric Category

Business Impact

Optimization Strategy

Social Engagement

Increases brand visibility and builds community

Use a mix of lifestyle images and product showcases

Customer Interaction

Offers insights through feedback

Respond quickly to comments to keep the conversation going

Content Performance

Highlights effective product presentations

Experiment with both static images and video formats

Sales Metrics

Directly linked to revenue

Track how social posts lead to completed purchases

Print2Social simplifies metric tracking and content creation by:

  • Producing 12 images and 8 videos per product for testing different content styles
  • Generating 20 unique social posts that balance promotions and educational value
  • Automating post schedules based on engagement trends

Every metric, from social engagement to sales conversions, plays a crucial role in refining your strategy.

For the best outcomes, POD store owners should focus on:

  • Tracking a Range of Metrics: Measure both short-term engagement (likes, shares) and long-term results (sales).
  • Using Automation Tools: Rely on Print2Social’s AI to ensure a steady flow of content.
  • Regularly Reviewing Data: Use engagement insights to fine-tune your marketing approach.
  • Balancing Your Content: Mix promotional posts with educational and community-focused content.

Top 5 AI Tools for Customer Journey Mapping

AI tools can simplify and enhance customer journey mapping for businesses, especially in print-on-demand. These tools help analyze data, predict customer behavior, and personalize experiences at scale. Here’s a quick overview of the top 5 AI tools for customer journey mapping:

  • Print2Social: Automates social media content creation with AI-generated images and videos tailored to different customer journey stages.
  • Salesforce Marketing Cloud: Uses AI for predictive analytics, real-time journey optimization, and cross-channel orchestration.
  • Adobe Journey Optimizer: Offers smart segmentation, real-time decision-making, and detailed journey analytics.
  • HubSpot Service Hub: Focuses on customer support with automated ticket routing, smart response suggestions, and unified analytics.
  • Clarabridge Engage: Leverages natural language processing (NLP) for sentiment analysis, omnichannel tracking, and journey visualization.

These tools help businesses save time, improve customer engagement, and optimize operations. Below, we dive into the features, benefits, and use cases for each tool.

How to Build a Customer Journey With Data and AI

Section titled “How to Build a Customer Journey With Data and AI”

Print2Social

Print2Social transforms how print-on-demand businesses manage their customer journey by automating social media content creation. At the heart of this platform is an AI-powered system that generates a collection of visuals for each product - 12 lifestyle images and 8 video clips that highlight practical, everyday use. This extensive content library forms the backbone of an effective social media strategy.

The platform’s content strategy focuses on a well-rounded approach that includes:

  • Promotional posts: Highlighting products and special deals
  • Engagement posts: Encouraging interaction and building community
  • Informative posts: Sharing useful insights to build credibility
  1. Connect your print-on-demand stores and social media accounts.
  2. Choose the products you want to promote using the user-friendly interface.
  3. Review and tweak the AI-generated content before it goes live.

With these steps, Print2Social simplifies the entire process, making it easy to maintain a personalized customer experience.

The platform produces 20 social media posts for each product, ensuring consistent brand messaging while tailoring content for different stages of the customer journey. This approach helps deliver engaging, relevant content no matter where customers are in their buying process.

For businesses juggling complex customer interactions, Print2Social’s AI takes over repetitive tasks, allowing teams to focus on strategy rather than execution. By syncing product catalogs with social accounts, it ensures your content stays accurate and up-to-date across every platform.

Salesforce Marketing Cloud

Salesforce Marketing Cloud leverages Einstein AI to streamline customer journey mapping, making it easier for businesses to handle complex interactions. It tracks customer activity across multiple channels, delivering insights backed by data.

The platform’s AI concentrates on three main areas:

  • Predictive Analytics: Analyzes past data to predict customer behavior and schedule interactions at the right time.
  • Journey Builder: Offers a drag-and-drop tool to design tailored customer journeys based on AI-generated insights.
  • Cross-Channel Orchestration: Ensures smooth coordination of customer interactions across email, mobile, social media, and websites.

These tools work together to fine-tune customer journeys in real time.

The system adapts customer journeys dynamically by analyzing:

  • Engagement Scores: Tracks how customers interact with various touchpoints.
  • Channel Preferences: Identifies the most effective communication methods for each customer.
  • Purchase History: Examines past buying patterns to forecast future actions.
  • Time-Based Triggers: Sends personalized messages at the most impactful moments.

All this data feeds into a dashboard that provides a clear view of journey performance with:

  • Journey Maps: Visual tools showing customer paths.
  • Conversion Metrics: Tracks success rates at different points in the journey.
  • Engagement Reports: Monitors interaction levels across all channels.
  • ROI Analysis: Measures the return on investment for each journey.

Salesforce Marketing Cloud excels at turning large volumes of customer data into practical insights, helping businesses optimize their customer interactions effectively.

Adobe Journey Optimizer

Adobe Journey Optimizer combines AI-driven analytics with real-time decision-making to create personalized customer experiences. Its AI engine analyzes data to fine-tune customer journeys across multiple channels.

Using AI, the platform identifies customer behavior patterns to suggest effective journey paths through features like:

  • Smart Segmentation: Groups customers automatically based on preferences and behaviors.
  • Predictive Engagement Scoring: Estimates how likely customers are to take specific actions.
  • Channel Optimization: Identifies the best communication channels for each customer group.

With real-time capabilities, the platform adapts journeys dynamically by:

  • Contextual Analysis: Combines current behavior with historical data to evaluate customer needs.
  • Automated Response Triggers: Activates personalized actions based on customer signals.
  • Cross-Channel Coordination: Ensures consistent messaging across web, mobile, and email.

This real-time approach is paired with detailed analytics to track the effectiveness of customer journeys.

The platform’s analytics dashboard offers detailed insights into customer journeys, including:

  • Journey Performance Metrics: Tracks where customers drop off and how many complete their journeys.
  • Interaction Analysis: Monitors engagement across various touchpoints.
  • Revenue Impact: Assesses the financial outcomes of journey adjustments.

Adobe Journey Optimizer includes tools for refining customer journeys through advanced testing:

1. Multivariate Testing

Automatically tests different journey variations to find the most effective options. It evaluates factors like:

  • Timing of messages
  • Personalization of content
  • Choice of communication channels
  • Combinations of offers

2. Predictive Analytics

Uses AI to anticipate journey outcomes by analyzing:

  • Past engagement trends
  • Seasonal patterns
  • Customer lifecycle stages
  • Buying behaviors

3. Optimization Recommendations

The system provides actionable suggestions based on ongoing analysis, such as:

  • Improving journey flows
  • Adjusting content
  • Fine-tuning timing
  • Selecting the right channels

Built-in compliance features ensure customer journeys meet privacy laws and align with brand standards across all channels. This helps businesses maintain trust and consistency in their messaging.

HubSpot Service Hub

HubSpot Service Hub is designed to improve customer support by leveraging AI tools and automation. It simplifies support processes and keeps a close eye on customer satisfaction to ensure a smoother experience.

Here are some standout features:

  • Automated ticket routing: Matches incoming requests with the right team members based on the complexity of the issue and the agent’s expertise.
  • Smart response suggestions: Helps maintain quick, consistent, and on-brand communication with customers.
  • Unified analytics dashboard: Provides a clear view of service metrics and identifies areas causing friction.

This system makes managing customer support more efficient and helps create a better overall experience.

Clarabridge Engage

Clarabridge Engage uses advanced natural language processing (NLP) to analyze customer interactions, uncover sentiment, and map out customer experiences in detail.

The platform stands out for its ability to process feedback from multiple sources, offering tools like:

  • Omnichannel Analysis: Tracks interactions across social media, email, chat, phone calls, and surveys, giving businesses a complete view of the customer journey.
  • Sentiment Analysis: Leverages AI to pick up on emotional tones in customer communications, helping pinpoint pain points and positive moments.
  • Journey Visualization: Builds visual maps of customer journeys, showing common paths, obstacles, and points where customers drop off.

These features help businesses take a more unified and proactive approach to understanding customer experiences.

With real-time analysis, businesses can:

  • Monitor satisfaction trends
  • Spot issues early, before they escalate
  • Evaluate the success of customer service efforts
  • Anticipate potential customer actions

The platform’s Smart Alerts flag unusual patterns, allowing teams to address problems quickly and effectively.

The Journey Analytics Dashboard provides insights into:

  • Interaction patterns across channels
  • Sentiment shifts over time
  • Performance metrics for different channels
  • Customer effort scores

With these tools, Clarabridge Engage helps businesses refine customer touchpoints and improve overall satisfaction.

AI-powered journey mapping plays a key role in helping print-on-demand businesses improve customer engagement and streamline operations.

When choosing an AI tool, focus on these critical factors:

Smooth Integration

  • Ensure the tool works effortlessly with your current print-on-demand platforms.
  • Confirm it supports your go-to social media channels.
  • Look for automation features that fit neatly into your workflow.

These elements help ensure the tool enhances your customer journey, as discussed earlier.

Content Creation Capabilities
For instance, tools like Print2Social can automate the creation of images, videos, and social media posts.

Flexibility and Control
Opt for tools that let you adjust content, manage scheduling, and stay true to your brand’s voice.

Ability to Scale
Make sure the tool can grow alongside your business. Check if it can handle:

  • Expanding product catalogs.
  • Multiple social media platforms.
  • Higher content production needs.

The future of journey mapping in print-on-demand lies in crafting tailored, efficient, and engaging customer experiences. By using these tools wisely, businesses can automate repetitive tasks while balancing technology with human creativity to maintain authenticity and quality.